

 Global
  United States
What is a Data Warehouse?
Nowadays, hyper-connected businesses drive rapid and informed decision-making from extracted actionable insights. This trend has turned into a necessity for strategic operational success and thus calls for data centers within Business Intelligence (BI) systems. Here, a central data store, repository, or warehouse aggregates large, structured, semi-structured, or raw, unstructured data from different data sources. A warehouse developed through cloud engineering services enables eased data integration to financial or CRM systems, storage, retrieval and enhances real-time reporting, historical trend analysis, data insights, quality, consistency, and accessibility.
It uses extract, load, and transform (ELT) or extract, transform, and load (ETL) processes for data preparation prior to analysis through BI systems. It is also noteworthy that as the amount of data increases, the related expenses, storage complexity, latency, and performance of the warehouse also increase subsequently, which can be resolved by using data lakehouses and cloud-native data warehouses. One needs to understand that data warehouses provided through software development services clean data for BI; data marts are a subset of warehouses focusing on a specific business line; data lakes store large raw data at affordable costs, while data lakehouses combine both warehouses and lakes for storage and analytics.
BI systems are utilized by data scientists and analysts to run queries in SQL, analyze the stored data (files, databases, warehouses, data lakes, and other cloud IoT solutions), and derive insights (reports, dashboards, and visualizations) for root causes and better decision-making (executives, leaders, mid-management, and other employees). The current global market for cloud data warehouse is estimated to be around US $14.94 billion as of 2026 and is expected to surge and reach an approximate value of US $49.12 billion by 2031, increasing at a CAGR of 26.86% during this forecast period. In this article, we will go through the importance of warehousing information through integration, storage, retrieval, and analysis of data that help businesses gain a competitive edge.
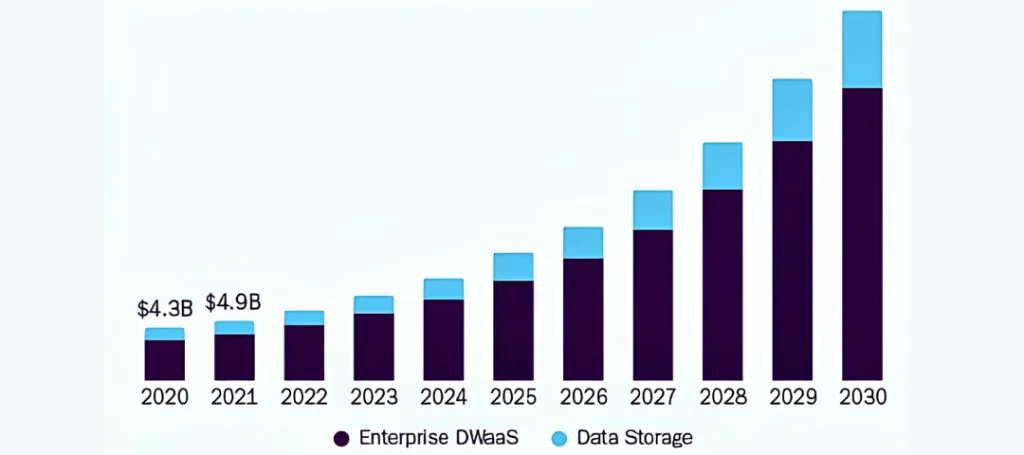
Source: Grand View Research
Growing market size of cloud data warehouse during the forecast period 2020 to 2030
History of Data Warehousing
1980s: The concept of warehousing large amounts of data emerged to find better ways for analysis.
1988: Two IBM researchers, Barry Devlin and Paul Murphy, introduced the in-depth concept of business data warehouses, which set the foundation for this field.
1990s: The specific term was coined and popularized by Bill Inmon to relate to subject-oriented, time-variant, integrated, and non-volatile data collection.
Late 1990s: A dimensional modeling approach on data marts and star schemas introduced by Ralph Kimball. Relational database management systems (RDBMS) and primary BI activities came into use for building early data warehouses.
2000s: With increasing data volumes, features of warehouses were expanded to support online analytical processing (OLAP), enterprise reporting, and dashboards.
2010s: This decade saw the rise of big data, which led to the integration of Apache Hadoop and cloud warehouses.
2020s: Scalability and flexibility with reduced infrastructure were made possible with cloud-powered data warehousing through services, such as Google BigQuery, Amazon Redshift, and Snowflake. Some commonly supported capabilities include BI applications, AI/ML, cloud-native architectures, handling varied types of data, data lakes, lakehouses, and real-time analytics.
Working of a Data Warehouse Architecture
Components
There are several components involved in the functioning of cloud migration solutions, such as these warehouses for storage, management, processing, and delivering data to undergo further analytics.
Transformation Tools
This includes the ETL tool that collects data from different sources in a staging area, transforms it, and loads it into the warehouse. It may also include the ELT processing framework where the data is loaded into the warehouse and then transformed, for example, Apache Spark, which manages data transformation.
Connectivity Layer
The application programming interface (API) layer assists in pulling the data from operational systems and integrating it with the same. This layer makes visualization and analytical tools available for the warehouse.
Database
The central database or data layer forms the conjunction where the system stores and integrates information from varied data sources, including other databases, webpages, email recipient lists, enterprise applications, and others. This layer is supported by the ELT/ETL pipelines and powered by an RDBMS or a cloud data warehouse.
Metadata
Data governance, management, and security policies are built-in hereto for partitioning data and restricted user access. This is done through a miniaturized data description, which is stored in the system for better searching and usability for BI analytics. The description includes technical metadata like data type and table structures, and descriptive metadata like file size, author, date of creation, etc.
Testing Environment
Certain data warehouse architecture includes an isolated testing environment known as the sandbox, which contains relevant analytical tools and a production data copy. The warehouse operations do not get affected while techniques for analysis present in the sandbox are being utilized by data scientists and analysts.
Data Access Tools
Tools such as dashboards, data visualization tools, and applications are connected to warehouses for enhanced frontend accessibility. These tools interact with collected data to extract insights, a few examples of which include Qlik, Looker, and Tableau.
Tiers
Here are the main three tiers of these warehouses that help them prepare data for analytics.
Database Tier
The data storage or bottom tier includes a warehouse server, which stores data flows from various sources. The flow occurs through an automated ETL integration process that organizes unstructured data prior to loading into the warehouse. In case of data lakes and some warehouses, ELT processes are used where the data is loaded prior to transformation, as they can store unstructured and semi-structured data in lieu of standard formats.
Application Tier
The middle or analytics processing tier of the data warehouse architecture includes an analytics engine working on the OLAP server system. These feature cubes that are array-based multidimensional structures for flexible analysis of large data volumes at high speed and complex query handling. It is useful for forecast planning, data mining, budgeting, and financial analysis and surpasses the traditional RDBMS that may not be able to handle multidimensional queries. For example, sales target values have various dimensions, such as location, product, time, etc.
OLTP, or online transaction processing systems, can capture real-time transactions in large numbers, whereas OLAP functions on pre-captured data analysis. The following types of OLAP may be used in a warehouse.
- Multidimensional OLAP (MOLAP) cubes showcase the quickest multidimensional analysis.
- Relational online analytical processing (ROLAP) works with relational tables for multidimensional data analysis before cube-like reorganization.
- Hybrid OLAP or HOLAP creates the required work distribution amongst multidimensional and relational databases all within one OLAP architecture.
User Interface Tier
The top or client tier performs reporting and ad hoc business data analysis and presents dashboards as the final front-end layer. BI tools enable warehouses to visualize and produce reports using trends and historical data while pinpointing bottlenecks in the workflow without expert manual intervention.
Approaches
Given below are the types of deployment models of these warehouses, right from on-premises systems to hybrid and cloud models, for example, a cloud-based attendance system.
On-Premises
This model highlights traditional warehouses that are hosted on business premises with commodity hardware. This type of deployment model involves high costs, as the devices can also be utilized as standalone appliances. They are beneficial for domains like healthcare and finance where data privacy and security standards are a necessity. The hardware can be laid out in the following manner.
-
Multiple Parallel Processing:
The MPP or symmetric multiprocessing (SMP) architecture enables distributed cloud computing, scaling, and faster performance. It uses multiple physical nodes where each node runs an instance without sharing any function.
-
Lambda Architecture:
This includes a speed layer for low-latency data, a batch layer for raw data processing and supporting complex analytics, and a serving layer for query responses.
-
Multi-Structured Data:
This type of infrastructure follows a polyglot persistence strategy for multiple data storage, big data, and analytics. Only portions of the entire data are integrated in the warehouses, which allows for query access in a federated manner.
-
Hybrid Architecture:
The MPP computer nodes are scaled up in case of higher volumes of queries and peak ETL workloads. It utilizes cloud for analytics and existing on-premises data structures.
Cloud
A cloud data warehouse offers certain advantages over other models, such as scalable cloud computing, agile data storage, flexible pay-as-you-go pricing options, etc. This model does not involve excessive investments in legacy infrastructure, software, hardware, or resources and is offered as an entirely managed software-as-a-service (SaaS), for example, a cloud-based manufacturing execution system. It is useful for organizations that rely on analytics and insights and seek lower data center footprints on their premises.
Hybrid
A hybrid model is also commonly adopted, as they offer advantages of both cloud and on-premises systems. Organizations can retain and secure sensitive information while benefitting from the cloud warehouses’ flexible and agile workloads.
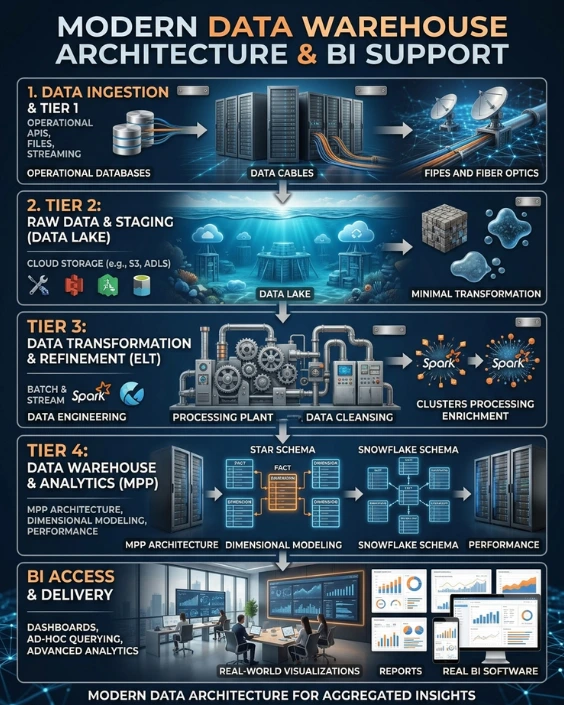
High-level diagram of data warehouse architecture and BI applications
Schemas
Schemas refers to the level and way of data organization in the context of warehouses. These are basically all dimensional data models that optimize retrieval of data in the OLAP systems by reducing redundancy, improving query performance, and streamlining localization of data. Schemas contain certain types of tables, which are as follows.
- Fact tables can store quantitative data, including revenue and product selling-related information.
- Dimension tables can store descriptive data, including sales dates and product categories that are contextual or factual in nature.
Here are some of the commonly used schema structures in the data warehouse management software.
Snowflake
In this type of schema structure, a central table is placed at the core, and various dimension tables expand outwards, which in turn extend to further dimension tables over many-to-one relationships. This complex pattern of branching represents a snowflake, which caters to lowered redundancy while slowing down the query performance.
Star
It is the most common and simplest type of schema structure and provides its users with faster querying speeds. In this case, a central fact table is encompassed by various dimension tables, thus representing a star-like pattern.
Galaxy
Also known as the fact-constellation schema, the galaxy schema consists of many different star schemas that share normalized dimension tables to minimize redundancy. It may feature lower performance but is useful for resolving queries across complex warehouses.
Types
Given below are the three types of warehouses commonly used across organizations.
Data Mart
It is a subset of existing warehouses and data sources that contain niche data customized for a particular business or department instead of the entire enterprise. For instance, a data mart aligned with marketing activities showcases focused analytical insights on campaign performance and customer segmentation in lieu of gathering information around the wider organizational dataset.
Enterprise Data Warehouse
An EDW acts as the central repository for historical data and subject areas and is utilized by the whole enterprise and its teams. The ODS and team cum departmental data marts may be included in the EDW.
Operational Data Store
The ODS consists of operational data in its most recent phase and is updated on a frequent basis for real-time data access. It is utilized by businesses for operational decision-making and analysis on a daily basis and can serve as a source for EDW and other systems.
Framework
A unified business view is created by warehouses as they extract data from various sources, which can be of the following types.
- Read-optimized data for quicker reporting and querying, but not frequently or in real-time.
- Integrated data that combines data from different sources like CRM, marketing tools, ERP, etc.
- Historical data is the raw information stored over time related to comparisons and trend analysis.
A common concept is the foundation-model experience framework that represents the general working of a data stack. The role of converting raw data into informed decisions is performed in a layer-wise manner. Here, the three layers refer to the following.
- Foundation: It represents the cloud data warehouse that stores centralized, historical, and integrated data for devising cloud application modernization and analytics strategy. In the absence of which, BI tools may analyze incomplete and inconsistent data, resulting in conflicted reporting and derailed business meetings. Cloud-based platforms like Databricks pull data from CRM, ERP, etc., and organize it into a query-optimized single repository. The storage, compute, and scalability are handled by the cloud, while BI tools can run real-time analysis.
- Model: This represents the data modeling and semantic layer that is present between the warehouse and BI tools. Data modeling converts raw data tables into business-ready organized datasets by consistently defining metrics, creating calculated fields, and defining relationships. The semantic layer in the data warehouse management software maps database structures and translates the same in business terms by standardizing concepts like customers, revenue, conversion rate, etc., across the organization. This avoids conflicting reports and normalizes ad hoc analysis, dashboard results, and agent query answers through metric systems.
- Experience: Here, the teams can directly interact with the stored data in cloud-based warehouses over BI platforms and, per se, the best logistics analytics solutions for efficiency. They can utilize queries to generate search-driven explanations, uncover insights, drill into any data point, and make decisions.
Workflow
By combining business intelligence with data warehousing over a modern data stack, an end-to-end AI predictive analytics workflow can be created. The above discussed framework can be accomplished in the following steps, which include conversion into actionable insights from raw data.
- Data Collection: Data from different sources (CRM, cloud-based ERP system, financial databases, and marketing platforms) is gathered in a particular data point by using automated ELT/ETL tools for integration and then loaded automatically through pipelines into a centralized warehouse.
- Data Storage: The collected data is stored in a cloud warehouse represented via a platform that has been optimized for queries on analysis for swifter performance, large data handling, and better BI analysis.
- Data Modeling: The collected and stored raw data is organized into a usable format using cleaning tools and techniques to build the semantic layer for defining logic and consistent metrics.
- BI Application: The cloud is then connected to the experience platform for analyzing data and making decisions in real-time. Application of BI and AI avoids creation of copies or stale extracts across the business in question.
Benefits of Data Warehousing and BI
Advantages
Pairing warehousing with intuitive BI applications and platforms allows users to conduct root cause analysis and gain insights across the business. Apart from making faster and smarter decisions, this combination can offer various other advantages to warehousing data, such as the following.
- Data Quality: ETL/ELT processing frameworks prepare the data through cleansing, deduplication, standardization, normalization, and inclusion of data governance practices for integrity and accuracy. A central database stores high-quality, pertinent data for users to access the same without any data silos. A few examples of open-source formats supported by enterprise-grade warehouses include Parquet, CSV, and Apache Iceberg.
- AI/ML Support: Contemporary AI-ready warehouses support machine learning and artificial intelligence-powered platforms, workloads, and workflows through reliable, validated, organized, structured, and cleaned data. However, data lakes as compared to warehouses may be utilized for building data science and analytics solutions, generative AI models, and fine-tuning existing models deployed for various business needs.
- Decision-Making: A data warehouse management software gains its information from a single source of truth, which enhances the view of comprehensive and dependable enterprise data. BI tools are utilized by users and leaders to access trends, themes, and aggregations, run AI video analytics, gain insights, and make forecasts for informed decision-making.
- Storytelling: In place of showcasing passive reporting and static charts, interactive visualizations can illustrate data storytelling and visual narratives and activate discovery for enhanced business outcomes.
- Data Exploration: These warehouses integrated with BI tools provide large and organized data that can be worked with and mined for client trends, hidden patterns, and new leads unlike siloed spreadsheets.
- Governed View: Such a setup is useful for clearing a team’s backlog, interactive, real-time ad-hoc query and answer sessions, reporting at scale, monitoring KPIs at a single source, governing dashboards, and standardizing metrics and goals for all employees right from the C-suite to the frontline workers.
Use Cases
The following are the different types of industry-specific use cases of warehousing data.
- Healthcare: Patient-related data, medication doses, test results, diagnostic codes, bills, demographics, and more can be stored centrally and analyzed. It can be used for obtaining in-depth insights on patient results for enhancing operational efficiency, etc.
- Manufacturing: Department or team-wise data marts can be built out from warehouses in the case of large OEMs and manufacturers that produce large amounts of data.
- Hospitality: Historical data can be used for choices across booking accommodations, traveling, targeted advertising, and promotions by organizations.
- Government: A data warehouse management software can be used for analyzing and understanding trends and patterns in crimes, traffic, and demographics.
Leverage Agile Data Infrastructure with KritiKal
KritiKal Solutions understands that warehousing data is necessary for business intelligence applications, which are in turn necessary for converting raw data into meaningful insights. Our solutions assist you in attaining outcomes that drive faster decision-making, accessibility, consistency, analytical capabilities, and data quality. Instead of traditional manual reporting across the organization, the need for a flexible, centralized, scalable, and structured repository for real-time analytics and BI systems is booming globally.
In this fast-paced world, there is no longer room for system overload, dispersed data, poor data quality, and lack of historical information, especially in critical domains that involve sensitive data. Certain business functions, such as finance and operations, rely on data warehouse architecture in lieu of alternate workflows, such as data lakes and ELT approaches, because of reliable analytical results. As a managed cloud services provider, we assure you that our modern solutions combine flexibility with structured processing to enhance decision efficiency and reduce time-to-insight as we maintain overall performance and data governance. Please get in touch with us at sales@kritikalsolutions.com to know more about our software-based products, platforms services, and realize your business requirements.

Sumit Singh Yadav currently works as a Testing Engineer at KritiKal Solutions. With his expertise around power electronics systems, prototype testing, debugging, SDLC, STLC, SQL, Jira, Postman, Cypress, testing methodologies including functional, regression, ad hoc, UI/UX, localization, compatibility testing and more, he has helped KritiKal in delivering some major projects to global clients.